NASA Spaceplace Column, May 2012
May 11, 2012
Thank Goodness for Magnetism
By Dr. Tony Phillips
Only 93 million miles from Earth, a certain G-type star is beginning to act up.
Every 11 years or so, the solar cycle brings a period of high solar activity. Giant islands of magnetism—”sunspots”—break through the stellar surface in increasing numbers. Sometimes they erupt like a billion atomic bombs going off at once, producing intense flares of X-rays and UV radiation, and hurling massive clouds of plasma toward Earth.
Multiple-wavelength view of X5.4 solar flare on March 6, captured by the Solar Dynamics Observatory (SDO) in multiple wavelengths (94, 193, 335 angstroms). Credit: NASA/SDO/AIA
This is happening right now. Only a few years ago the Sun was in a state of deep quiet, but as 2012 unfolds, the pendulum is swinging. Strong flares are becoming commonplace as sunspots once again pepper the solar disk. Fortunately, Earth is defended from solar storms by a strong, global magnetic field.
In March 2012, those defenses were tested.
At the very beginning of the month, a remarkable sunspot appeared on the Sun’s eastern limb. AR1429, as experts called it, was an angry-looking region almost as wide as the planet Jupiter. Almost as soon as it appeared, it began to erupt. During the period March 2nd to 15th, it rotated across the solar disk and fired off more than 50 flares. Three of those eruptions were X-class flares, the most powerful kind.
As the eruptions continued almost non-stop, Earth’s magnetic field was buffeted by coronal mass ejections or “CMEs.” One of those clouds hit Earth’s magnetosphere so hard, our planet’s magnetic field was sharply compressed, leaving geosynchronous satellites on the outside looking in. For a while, the spacecraft were directly exposed to solar wind plasma.
Charged particles propelled by the blasts swirled around Earth, producing the strongest radiation storm in almost 10 years. When those particles rained down on the upper atmosphere, they dumped enough energy in three days alone (March 7-10) to power every residence in New York City for two years. Bright auroras circled both poles, and Northern Lights spilled across the Canadian border into the lower 48 states. Luminous sheets of red and green were sighted as far south as Nebraska.
When all was said and done, the defenses held—no harm done.
This wasn’t the strongest solar storm in recorded history—not by a long shot. That distinction goes to the Carrington Event of September 1859 when geomagnetic activity set telegraph offices on fire and sparked auroras over Mexico, Florida, and Tahiti. Even with that in mind, however, March 2012 was remarkable.
It makes you wonder, what if? What if Earth didn’t have a magnetic field to fend off CMEs and deflect the most energetic particles from the Sun.
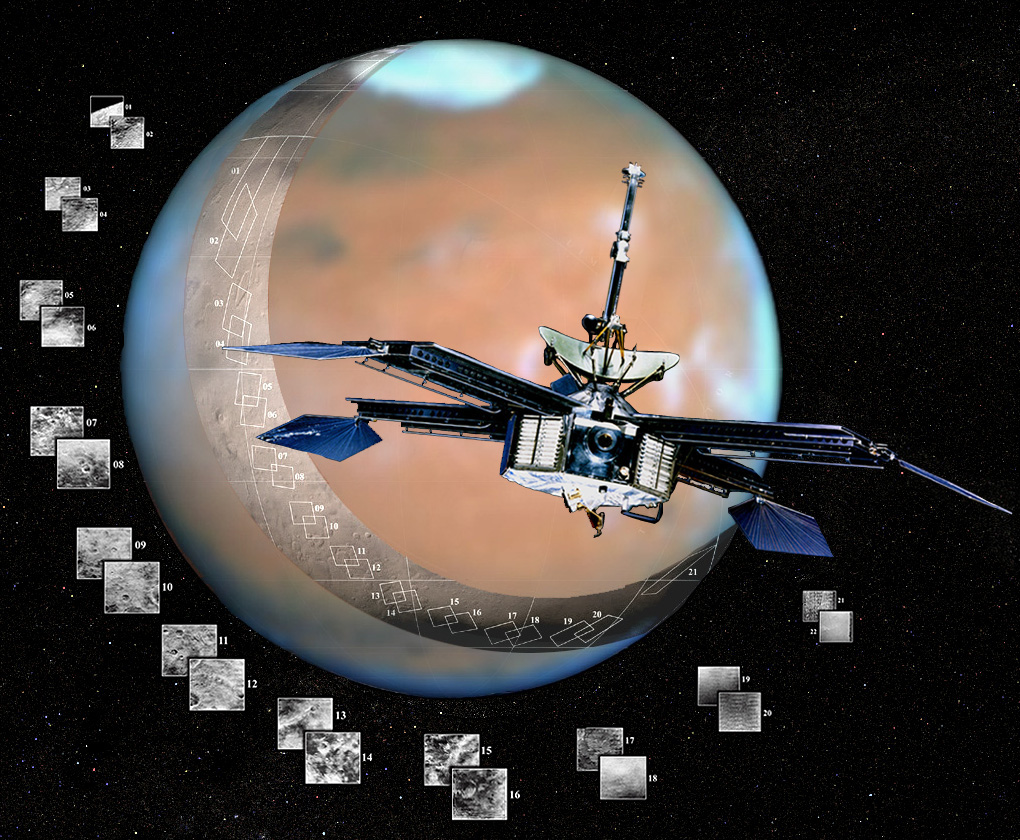
The answer might lie on Mars. The red planet has no global magnetic field and as a result its atmosphere has been stripped away over time by CMEs and other gusts of solar wind. At least that’s what many researchers believe. Today, Mars is a desiccated and apparently lifeless wasteland.
Only 93 million miles from Earth, a G-type star is acting up. Thank goodness for magnetism.
With your inner and outer children, read, watch, and listen in to “Super Star Meets the Plucky Planet,” a rhyming and animated conversation between the Sun and Earth, athttp://spaceplace.nasa.gov/story-superstar.
This article was provided by the Jet Propulsion Laboratory, California Institute of Technology, under a contract with the National Aeronautics and Space Administration.
NASA Spaceplace Column, April 2012
April 12, 2012
NASA Helps Europe Study a Comet–
Up Close and Personal
By Dr. Tony Phillips
Europe’s Rosetta spacecraft is on its way to intercept comet 67P/Churyumov-Gerasimenko. Comets have been intercepted before, but this mission is different. Rosetta aims to make history by landing a probe on the comet’s surface while the mother ship orbits overhead.
Rosetta’s lander Philae will eject from the spacecraft, touch down on the comet’s nucleus, and immediately fire a harpoon into the surface to anchor itself so it won’t drift off in the weak gravity.
“Rosetta is the European equivalent of a NASA flagship mission,” explains Claudia Alexander, project scientist for the U.S. Rosetta Project at NASA’s Jet Propulsion Laboratory. “It will conduct the most comprehensive study of a comet ever performed.”
Rosetta’s payload contains 21 instruments (11 on the orbiter, 10 on the lander) designed to study almost every aspect of the comet’s chemistry, structure, and dynamics. Three of the sensors were contributed by the U.S.: Alice (an ultraviolet spectrometer), IES (an ion and electron sensor), and MIRO (a microwave sounder).
The main event of the mission will likely be the landing. The 100-kg lander, which looks a bit like a cross between NASA’s old Viking Mars landers and a modern microsatellite, will spend two weeks fastened to the comet’s icy surface. The European-built probe will collect samples for analysis by onboard microscopes and take stunning panoramic images from ground level.
“First the lander will study the surface from close range to establish a baseline before the comet becomes active,” explains Alexander. “Then the orbiter will investigate the flow of gas and dust around the comet’s active, venting nucleus.”
Rosetta’s sensors will perform the experiments that reveal how the chemicals present interact with one another and with the solar wind. Alice and MIRO detect uncharged atoms and molecules, while IES detects the ions and electrons as the solar wind buffets the nucleus.
One problem that often vexes astronomers when they try to study comets is visibility. It’s hard to see through the dusty veil of gas billowing away from the heated nucleus. The microwaves MIRO detects can penetrate the dust, so MIRO can see and measure its target molecules even when other instruments can’t.
MIRO is one of several experiments focused on the comet’s structural properties. It will determine the comet’s dielectric constant, emissivity, and thermal conductivity to determine whether it is made of a powdery loose material, has a detectable layer of loose material, or is hard as rock.
“We want to find out whether comets have retained material from when the solar system formed,” says Alexander. “If the ancient materials are still there, we can get an idea of what conditions were like at the dawn of the solar system.”
Rosetta enters orbit in 2014. Stay tuned for updates!
This article was provided by the Jet Propulsion Laboratory, California Institute of Technology, under a contract with the National Aeronautics and Space Administration.
NASA Spaceplace Column, March 2012
March 28, 2012
The Planet in the Machine
By Diane K. Fisher and Tony Phillips
The story goes that a butterfly flapping its wings in Brazil can, over time, cause a tornado in Kansas. The “butterfly effect” is a common term to evoke the complexity of interdependent variables affecting weather around the globe. It alludes to the notion that small changes in initial conditions can cause wildly varying outcomes.
CloudSat is one of the Earth-observing satellites collecting data that will help develop and refine atmospheric circulation models and other types of weather and climate models. CloudSat’s unique radar system reads the vertical structure of clouds, including liquid water and ice content, and how clouds affect the distribution of the Sun’s energy in the atmosphere.
Now imagine millions of butterflies flapping their wings. And flies and crickets and birds. Now you understand why weather is so complex.
All kidding aside, insects are not in control. The real “butterfly effect” is driven by, for example, global winds and ocean currents, polar ice (melting and freezing), clouds and rain, and blowing desert dust. All these things interact with one another in bewilderingly complicated ways.
And then there’s the human race. If a butterfly can cause a tornado, what can humans cause with their boundlessly reckless disturbances of initial conditions?
Understanding how it all fits together is a relatively new field called Earth system science. Earth system scientists work on building and fine-tuning mathematical models (computer programs) that describe the complex inter-relationships of Earth’s carbon, water, energy, and trace gases as they are exchanged between the terrestrial biosphere and the atmosphere. Ultimately, they hope to understand Earth as an integrated system, and model changes in climate over the next 50-100 years. The better the models, the more accurate and detailed will be the image in the crystal ball.
NASA’s Earth System Science program provides real-world data for these models via a swarm of Earth-observing satellites. The satellites, which go by names like Terra and Aqua, keep an eye on Earth’s land, biosphere, atmosphere, clouds, ice, and oceans. The data they collect are crucial to the modeling efforts.
Some models aim to predict short-term effects—in other words, weather. They may become part of severe weather warning systems and actually save lives. Other models aim to predict long-term effects—or climate. But, long-term predictions are much more difficult and much less likely to be believed by the general population, since only time can actually prove or disprove their validity. After all, small errors become large errors as the model is left to run into the future.
However, as the models are further validated with near- and longer-term data, and as different models converge on a common scenario, they become more and more trustworthy to show us the future while we can still do something about it—we hope.
For a listing and more information on each of NASA’s (and their partners’) Earth data-gathering missions, visit http://science.nasa.gov/earth-science/missions/.
This article was provided by the Jet Propulsion Laboratory, California Institute of Technology, under a contract with the National Aeronautics and Space Administration.
Sky Object of the Month – April 2012
March 14, 2012
Double Star Gamma Leonis – Algieba
by Glenn Chaple
One of the finest double stars in the spring sky – indeed, in all the heavens – is gamma Leonis. Its proper name, Algieba, comes from the Arabic Al Jabbah (The Lion’s Mane).
Discovered by William Herschel in 1782, Algieba is comprised of magnitude 2.4 and 3.6 stars currently separated by 4.6 arc-seconds. They form a slowly widening binary system with an orbital period estimated at between 5 and 6 centuries.
Algieba is easily located – it’s the brightest star (after Regulus) in the “Sickle” of Leo. The pair is marginally resolved in small-aperture telescopes with medium power. On an evening of steady seeing, I barely split Algieba with a 3-inch reflector at 60X. A clean split, however, requires a magnification of 100X or more.
What makes Algieba so visually striking are its rich golden-yellow hues, indicative of its K0 and G7 spectra. Some observers note a slight greenish tinge to the companion. Do you agree?
Sky Object of the Month – March 2012
February 19, 2012
Variable Star R Leonis
by Glenn Chaple
On the evening of March 1, 1918, a young Ohio farm boy trained a small refracting telescope towards the variable star R Leonis. He estimated its brightness, later forwarding the information to the American Association of Variable Star Observers. It was the first of over 132.000 variable star observations the legendary Leslie Peltier would submit to the AAVSO.
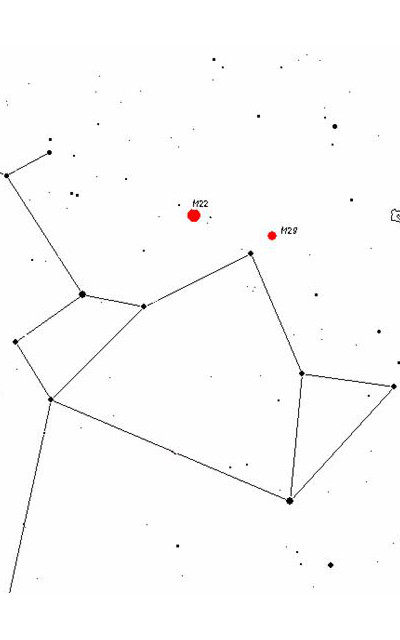
Since Peltier’s time, R Leo has introduced dozens of amateur astronomers to the rewarding pastime of variable star observing. R Leo is tailor-made for the novice for two reasons – it’s easy to find and easy to observe. You’ll find R Leo by directing your telescope slightly north of a spot one-third of the way from omicron Leonis to Regulus (the circled area on the accompanying map of Leo).
Comparison stars within one degree of R Leonis (AAVSO)
An expanded view of that circle shows R Leonis and the magnitudes of nearby comparison stars, decimals omitted. R Leonis is bright enough (its average magnitude range is 5.8 to 10.0) to be seen in binoculars when near maximum and with a small-aperture telescope throughout its 312-day cycle.
The magnitude range and period attributed to R Leonis are typical of a class of variable stars known as Mira-type, or Long-Period Variables (LPVs). Like its kindred LPVs, R Leonis is a cool red giant – a dying star whose brightness changes result from internal pulsations.
Based on recent observations, R Leonis has a magnitude in the mid-8 area and is rising to a predicted maximum later this month. The time is ripe for you to jump in and become acquainted with the variable star that launched Leslie Peltier’s stellar career.
NASA Spaceplace Column, February 2012
February 13, 2012
The Hidden Power of Sea Salt, Revealed
Last year, when NASA launched the Aquarius/SAC-D satellite carrying the first sensor for measuring sea salt from space, scientists expected the measurements to have unparalleled sensitivity. Yet the fine details it’s revealing about ocean saltiness are surprising even the Aquarius team.
Aquarius produced this map of global ocean salinity. It is a composite of the first two and a half weeks of data. Yellow and red represent areas of higher salinity, with blues and purples indicating areas of lower salinity.
“We have just four months of data, but we’re already seeing very rich detail in surface salinity patterns,” says principal investigator Gary Lagerloef of Earth & Space Research in Seattle. “We’re finding that Aquarius can monitor even small scale changes such as specific river outflow and its influence on the ocean.”
Using one of the most sensitive microwave radiometers ever built, Aquarius can sense as little as 0.2 parts salt to 1,000 parts water. That’s about like a dash of salt in a gallon jug of water.
“You wouldn’t even taste it,” says Lagerloef. “Yet Aquarius can detect that amount from 408 miles above the Earth. And it’s working even better than expected.”
Salinity is critical because it changes the density of surface seawater, and density controls the ocean currents that move heat around our planet. A good example is the Gulf Stream, which carries heat to higher latitudes and moderates the climate.
“When variations in density divert ocean currents, weather patterns like temperature and rainfall are affected. In turn, precipitation and evaporation, and fresh water from river outflow and melt ice determine salinity. It’s an intricately connected cycle.”
The atmosphere is the ocean’s partner. The freshwater exchange between the atmosphere and the ocean dominates the global water cycle. Seventy-eight percent of global rainfall occurs over the ocean, and 85 percent of global evaporation is from the ocean. An accurate picture of the ocean’s salinity will help scientists better understand the profound ocean/atmosphere coupling that determines climate variability.
“Ocean salinity has been changing,” says Lagerloef. “Decades of data from ships and buoys tell us so. Some ocean regions are seeing an increase in salinity, which means more fresh water is being lost through evaporation. Other areas are getting more rainfall and therefore lower salinity. We don’t know why. We just know something fundamental is going on in the water cycle.”
With Aquarius’s comprehensive look at global salinity, scientists will have more clues to put it all together. Aquarius has collected as many sea surface salinity measurements in the first few months as the entire 125-year historical record from ships and buoys.
“By this time next year, we’ll have met two of our goals: a new global map of annual average salinity and a better understanding of the seasonal cycles that determine climate.”
Stay tuned for the salty results. Read more about the Aquarius mission at aquarius.nasa.gov.
Other NASA oceanography missions are Jason-1 (studying ocean surface topography), Jason-2 (follow-on to Jason-1), Jason-3 (follow-on to Jason-2, planned for launch in 2014), and Seawinds on the QuikSCAT satellite (measures wind speeds over the entire ocean). The GRACE mission (Gravity Recovery and Climate Experiment), among its other gravitational field studies, monitors fresh water supplies underground. All these missions, including Aquarius, are sponsors of a fun and educational ocean game for kids called “Go with the Flow” atspaceplace.nasa.gov/ocean-currents.
This article was provided by the Jet Propulsion Laboratory, California Institute of Technology, under a contract with the National Aeronautics and Space Administration.
Sky Object of the Month – February 2012
February 10, 2012
Asteroid 433 Eros
by Glenn Chaple
Last November, astronomers were treated to a fly-by of the near-earth asteroid 2005 YU 55. An 11th magnitude object, 2005 YU 55 raced across the sky at an astounding rate of one degree every 10 minutes. Viewing the event required a telescope of 6-inch aperture or larger.
Very rarely does a near-earth asteroid become bright enough to be seen with small backyard scopes. A notable exception is the asteroid 433 Eros. The number “433” indicates that Eros was the 433rd asteroid to be found and catalogued – the honor going to the German astronomer Carl Witt, who spotted Eros in August of 1898. Eros is normally a faint object, but every few decades it passes near enough to brighten to 7th or 8th magnitude. One of those favorable apparitions is currently underway.
Around the time of its nearest approach on January 31, Eros will be 16.6 million miles from earth – 80 times more distant that 2005 YU 55 was during its November visit. Eros’ motion, therefore, won’t be as frenetic, but you’ll detect a definite displacement in a matter of minutes, especially when Eros passes a background star.
During the 20th century, studies of Eros hinted that it might be an elongated body. In 2000, Eros was visited by the NEAR Shoemaker spacecraft, which orbited and imaged the asteroid for a year before making a soft landing on its surface. NEAR Shoemaker confirmed that Eros is indeed elongated, with dimensions of 22 X 8 X 8 miles.
Eros’ last close encounter was in 1975. It won’t be a small-scope target again until 2056, so you won’t want to miss this opportunity. For more information about the Eros encounter, refer to the February, 2012, issues of Astronomy (pages 48 and 49) and Sky and Telescope (page 52). For a printable finder chart, log on tohttp://media.skyandtelescope.com/documents/WEB_Feb12_Eros.pdf.
NASA Spaceplace Column, January 2012
January 12, 2012
The Nerdiest Video Game Ever
By Dr. Tony Phillips
NASA has a job opening. Wanted: People of all ages to sort, stack, and catalogue terabytes of simulated data from a satellite that launches in 2015. Agile thumbs required.
Sorting terabytes of data? It’s more fun than it sounds.
In fact it’s a game: Satellite Insight. The Space Place Team at the Jet Propulsion Laboratory created the entertaining app for iPhones to get the word out about GOES-R, an advanced Earth science satellite built by NOAA and NASA.
Described by the Los Angeles Times as possibly “the nerdiest game ever,” Satellite Insight may be downloaded for free from Apple’s app store. Be careful, though, once you start playing it’s hard to stop. Some reviewers have likened it to Tetris, one of the most popular video games of all time.
GOES, short for “Geostationary Operational Environmental Satellite,” is the workhorse spacecraft for weather forecasters. NOAA operates two (at a time) in geosynchronous orbit, one above the west coast of N. America and one above the east coast. They monitor clouds, wind, rain, hurricanes, tornadoes and even solar flares. The GOES program has been in action since 1975.
GOES-R is the next-generation satellite with advanced technologies far beyond those of the older GOES satellites. It has sensors for lightning detection, wildfire mapping, storm tracking, search and rescue, solar imaging, and more. Many of the sensors are trailblazers. For example, the Advanced Baseline Imager has 60 times the capability of the current imager—16 channels instead of 5. It has twice the spatial resolution and five times the temporal refresh rate, including the 30-second imaging of weather systems over a region of 1000 km x 1000 km.
Also, the Geostationary Lightning Mapper can count and pinpoint lightning bolts over the Americas 24/7. It’s the first such detector to fly on a geosynchronous satellite, and it could lead to transformative advances in severe storm warning capability.
All in all, GOES-R represents a “huge technological leap from the current GOES.” We know this because Satellite Insight tells us so. The app has an informative “Learn More” feature where players can find out about the satellite and the data they have been sorting.
Which brings us back to sorting data. It’s a bit like eating Cheerios; just don’t tell the kids it’s nutritious, and they love it. Helping GOES-R gather and stash data from all those advanced sensors is just as satisfying, too—a dose of Earth science wrapped in thumb-flying fun.
More information about Satellite Insight may be found on the web athttp://itunes.apple.com/us/app/satellite-insight/id463588902?mt=8. The game also available in web form (flying thumbs optional) at spaceplace.nasa.gov/satellite-insight.
This article was provided by the Jet Propulsion Laboratory, California Institute of Technology, under a contract with the National Aeronautics and Space Administration.
Sky Object of the Month – January 2012
December 19, 2011
M74 – Galaxy in Pisces
by Glenn Chaple
Last month, we explored the galaxy M33, a notoriously difficult telescopic target due to its extremely low surface brightness. For the same reason, M74 is even more challenging; in fact, many consider it the most visually demanding of all the Messier objects.
Upon discovering this galaxy in 1780, the French astronomer Pierre Mechain remarked, “It is quite broad, very dim, and extremely difficult to observe.” M33 is commonly described as a 6th magnitude star defocused until its light is spread over an area twice the apparent diameter of the moon. With M74, we have a magnitude 9.5 star whose light is extended over an area 10 arc-minutes across. No wonder M74 bears the nick-name the “Phantom Galaxy!”
The good news is that M74 can be captured if you know where to look and (most importantly!) observe from a clear, dark sky. In fact, I’ve glimpsed it (albeit faintly) with a 3-inch f/6 reflector. Viewed with averted vision, it appeared as a ghostly blob of light. The key was in conducting my search with a low power (30X) eyepiece.
M74 is situated 15 degrees south of its elusive cousin and 1 ½ degrees east and slightly north of the 4th magnitude star eta () Piscium (refer to the accompanying finder chart). In size, it’s essentially an equal to our Milky Way. M74 lies about 32 million light years away, about 15 times more distant than M33.
 This month's speaker at the September 14 GAAC meeting will be a club favorite, our own long-time member Gary Meehan.